Table of Contents
Leading Edge Supply and Demand Analysis
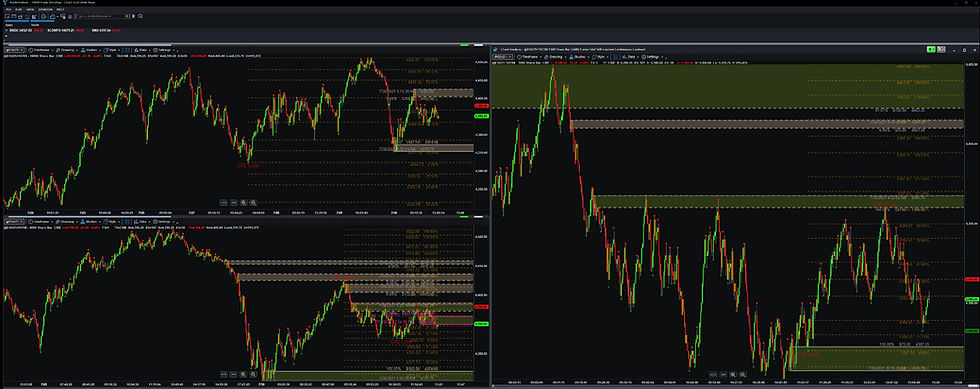
The Tools for Traders Basic Edition offers an objective, fully automated, and consistent supply and demand analysis for your markets. This analysis is performed continuously, with the results displayed on your charts in real time. Benefit from faster and more accurate market insights that are applicable across various chart types and intervals.
Enhanced Visualization of Supply & Demand. The Chart Tool Basic can find and mark on your charts:
-
Swing Highs and Lows
-
Segments
-
Trend
-
Supply and Demand Bands
Additional features:
-
Supports Optimized Settings Files (OSF files)
-
Can use Pro OSF files for pre-canned configurations
-
Swing Highs and Lows
-
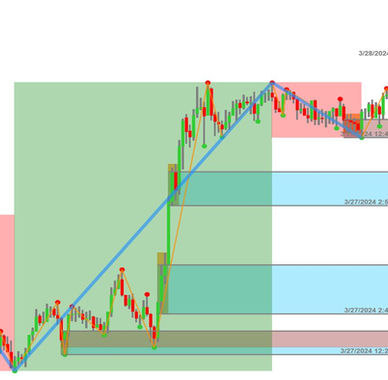
Swing Highs are indicated by placing a red dot above the swing high candle
-
Swing Lows are indicated by placing a green dot below the swing low candles
-
The size, color, and position of the dots used to mark swings are user configurable
Segments
-
Segments form the low level trend (microtrend) for the chart
-
Can be shown on the chart using trend lines or Bull & Bear boxes
Trend
-
The impulse and corrective moves of the major trend for the interval can be marked using trend lines, Bull &Bear boxes, or both (as in the example to the left).
Supply and Demand Bands
-
More than 30 rules are used to find supply and demand bands.
-
Band Origin showing the pattern that created the band will be marked
-
Supply bands are marked with a dot- dash pattern while demand bands are marked with solid lines so they are easy to tell apart
-
Bands are colored to show, at a glance, how far price has penetrated the band (light blue for areas price has not reached, light red for areas that price has retested)
-
The amount of time that a broken band is displayed on the chart is under user control
-
Supply and Demand bands can be labeled with the date/time the band was created, the percent of the band that has been penetrated, the width of the band in dollars, as well as the price level of the proximal and distal lines of the band
OSF File Support
-
Supports Optimized Settings Files (OSF files)
-
Can use Pro OSF files for pre-canned configurations
-
The user has the ability to control the loading and use of Pro OSF files.
-
The user has the ability to override any setting configured by a Pro OSF file.
-
Personalize your Charts
-
Combine Chart Tool features to create the charts you need!
-
Display just the information you want or need for the strategies you are using
-
Customize the look and feel of your charts to convey information as quickly and easily as possible
-
Spend less time charting and more time on other aspects of your trading
-
The Basic Edition is specifically designed for the beginning Supply & Demand trader!
Is the Basic Edition Right for me?
Our Basic Edition is for you if you are looking for a simple indicator that objectively identifies areas of supply and demand, swing highs and lows, and trend using a fixed set of rules. If you are not a Supply & Demand trader, then you may be interested in the TA Edition which supports more traditional trading styles.
Also, please feel free to join us in The Foundry . The Foundry is free and is open to all traders for trading related activities.
Explore Other Editions
Answers to your questions
Here are some answers to commonly asked questions:
How do I get started?
To get started, you should register on the website . Before selecting a Tools for Traders edition, you may wish to attend one or more of the Tools for Traders Public Forums where you can see the Tools in action, ask questions, and meet the Community. These are held in The Foundry and are listed on the Community Events Calendar . The Foundry is free and open to all traders for trading related activities.
What tools do you offer?
We offer a range of leading edge tools which provide pertinent information and real-time market analysis which can be customized to support your trading strategies.
Is my data secure?
Yes, we take data security seriously. We use industry-standard encryption and follow strict privacy protocols to ensure the safety and confidentiality of your information.
Can I cancel my subscription?
Monthly subscriptions can be canceled. A monthly subscription should be canceled at least 48 hours before the renewal date to allow for proper processing. Yearly subscriptions, due to the discounts given, are paid in full in advance and can not be canceled.


